Introduction

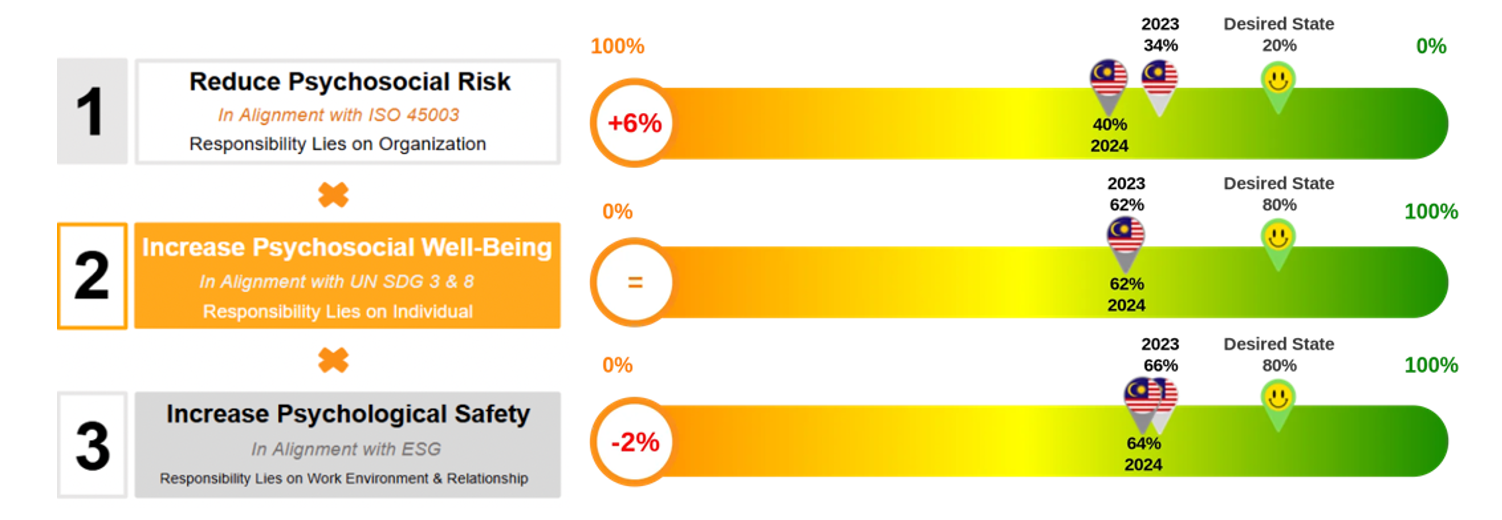
The Malaysia Well-being@Work© (W@W©) Index is the first unified, validated measure of workplace well-being, assessing Psychosocial Risk, Psychosocial Well-being, and Psychological Safety of employees. Additionally, it incorporates Self-Esteem as a supplementary factor in workplace well-being.

Aligned with ISO 45003, the UN Sustainable Development Goals (SDGs 3 & 8), the International Labour Organization's Workplace Well-being Goals, and ESG Social Goals, it also adheres to Malaysia’s OSH Act (Amendment) 2022.

The W@W© Index is gathered directly from employees within organizations. Employees access their results through the Psych Me App, while organizations and managers utilize the PsychMe Dashboard. Data collected across workplaces feeds into the World Well-being@Work© Dashboard, providing a comprehensive World Well-being@Work© Index Report.

This global-first report offers insights, trends, and actionable recommendations to drive workplace well-being, setting a new standard for nations worldwide.

Psychosocial Risk

How much stress or pain employees experience at work

“What’s Causing Chaos In Your 9 To 5?"

14 Items 20 Risk Factors

Psychosocial Well-being

How well employees are managing their stress or pain

“Are You At Your Best State to Score Goals?”

14 Items 3 Well-being Domains

Psychological Safety

How safe employees feel to take positive action and be brave

“Do You Feel Safe To Be Brave?”

7 Items 4 Safety Domains

Image

Findings: The Malaysia W@W©Index for 2024 has decreased by 3% since 2023. Psychosocial Risk score has increased by 6% from 34% to 40%, Psychosocial Well-being score has stayed the same at 62% and Psychological Safety score has decreased by 2% from 66% to 64%.

The State of Workplace Well-being in Malaysia

Index

The 2024 Malaysia Well-being@Work© was at 62%, this represents a decrease of overall Well-being by 3% since 2023.

Gender

Female employees (60%) reported a lower W@W© Index compared to male employees (63%) by 3%. 

Age

Employees in the 18-30 yrs age group had the lowest W@W© Index at 60% while employees who are above 60 yrs were at 70%. 

Job Level

Non-executive employees (58%) have the lowest W@W© Index compared to General Managers (69%) by 11%. 

Tenure

In 2024, employees of 1-3 yrs tenure (61%) reported the largest decrease in W@W© Index scores by 3%.

Why This Report Matters

Track Year-on-Year Trends

Understand how workplace well-being is changing, with insights on Psychosocial Risk, Psychosocial Well-being, and Psychological Safety.

Demographic Insights

See how all three Well-being@Work© measures vary across gender, age, job level, and tenure, helping identify vulnerable groups.

Workplace Challenges & Risks

Gain a clearer picture of rising concerns in stress levels, well-being, and psychological safety.

Actionable Recommendations

Access expert-driven recommendations to improve workplace well-being.

Who Should Read This Report

Government & Regulators

Understand the state of workplace well-being to guide national policies.

CEOs & Business Leaders

Gain strategic insights to improve ESG & workplace culture.

HR & Well-being Practitioners

Shape policies that drive a culture of well-being.

Employees & Advocates

Learn how workplace well-being is evolving and advocate for change.

Quotes from Author and Partners

Image